Multivariate Normal Distribution
Multivariate Normal Distribution
Easy:
Imagine you have a box of crayons that can make any color you want just by mixing them together. Now, let’s say you have three different colors: red, blue, and green. If you mix these colors in equal amounts, you get a beautiful shade of purple.
But what if you don’t use equal amounts? Maybe you add more red than blue and green, or maybe you mix them in different ways each time. The result will always be some shade of purple, but it might look slightly different every time because of how much of each color you used.
Now, imagine if instead of just three colors, you had many, many crayons, and you could mix them all together in endless combinations. That’s kind of like what a multivariate normal distribution is, but instead of colors, we’re talking about numbers.
In a multivariate normal distribution, you have lots of different numbers (or variables) that can change and combine in many ways. Just like how you can create many shades of purple by mixing your crayons, you can create many different outcomes by combining these numbers in different ways.
The “normal” part means that most of the time, when you mix these numbers together, you’ll end up with something that looks pretty average or typical. It’s like saying that if you keep mixing your crayons, most of the time, you’ll probably get a nice, bright purple.
So, a multivariate normal distribution is just a fancy way of saying that when you have lots of numbers that can mix and match in many ways, most of the time, the results will be pretty average and predictable.

Moderate:
Multivariate Normal Distribution is a statistical concept that describes the probability distribution of multiple variables at once. Imagine you’re dealing with a set of data points where each point has several characteristics or features. For example, consider a group of people, each described not only by their height but also by their weight, age, and shoe size. In this scenario, each person’s height, weight, age, and shoe size are variables.
A univariate normal distribution deals with one variable at a time, like the heights of people. A bivariate normal distribution considers two variables, such as both height and weight. However, a multivariate normal distribution goes further, encompassing three or more variables simultaneously.
Key Characteristics:
- Mean Vector: This is the center point of the distribution, representing the average values of all variables. For our example, it would include the mean height, mean weight, etc.
- Covariance Matrix: This matrix shows how each variable interacts with every other variable. High positive values indicate a strong direct relationship between variables (e.g., taller people tend to weigh more), while high negative values suggest an inverse relationship (e.g., older people tend to be shorter). Diagonal elements represent the variance of each variable, indicating how much each variable differs from its mean on average.
- Independence: In a perfect multivariate normal distribution, variables are independent, meaning the value of one does not affect the others. In reality, variables often have some degree of dependence.
- Normality: Each variable follows a univariate normal distribution when considered independently. This means the distribution of each variable, if plotted, would form a bell curve.
- Bell Curve for Each Variable: Even though we’re looking at multiple variables, each individual variable (if isolated) would still follow a normal distribution, appearing as a bell curve when graphed.
Practical Use:
Multivariate Normal Distribution is crucial in statistics for understanding complex datasets where relationships among various factors need to be analyzed. It’s used in fields ranging from finance (to model returns on multiple assets) to genetics (to understand how different traits are inherited).
Example:
Imagine you’re trying to predict a student’s final grade based on their scores in three subjects: Math, Science, and English. If these scores follow a multivariate normal distribution, you can use statistical methods to understand how these subjects relate to each other and to the final grade. This could help identify if students who perform well in Math also tend to do well in Science and English, or if there’s no correlation between these subjects.
In summary, Multivariate Normal Distribution is a powerful tool for analyzing and predicting relationships among multiple variables, providing insights into complex datasets.
Hard:
The multivariate normal distribution is a generalization of the univariate (one-dimensional) normal distribution to multiple dimensions. It describes a probability distribution over vectors in a d-dimensional space, where d is a positive integer.
A random vector X = (X1, X2, …, Xd) follows a multivariate normal distribution if its density function can be written as:
f(x) = (1 / (sqrt((2π)^d * |Σ|))) \* exp(-0.5 \* ((x — μ)’ \* Σ^-1 \* (x — μ)))
where:
* x is a column vector representing a particular point in the d-dimensional space;
* μ is a column vector of means for each dimension;
* Σ is the covariance matrix, which encodes information about the variances and correlations among the different dimensions;
* |Σ| denotes the determinant of the covariance matrix;
* ‘ denotes the transpose operator;
* exp() is the exponential function.
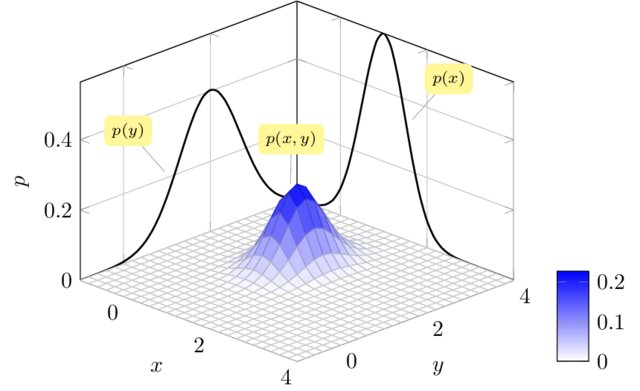
The multivariate normal distribution is completely specified by its mean vector μ and covariance matrix Σ. Intuitively, the mean vector gives the center of mass of the distribution, while the covariance matrix captures the shape and orientation of the ellipsoidal contours of equal probability. In particular, the eigenvectors of the covariance matrix determine the directions of the principal axes of the ellipse, while the corresponding eigenvalues give the lengths of those axes.
One important property of the multivariate normal distribution is that linear transformations preserve normality. That is, if X follows a multivariate normal distribution and A is a constant matrix, then the transformed random vector Y = AX also follows a multivariate normal distribution, with mean vector μ\_Y = Aμ and covariance matrix Σ\_Y = AΣA’. This property makes the multivariate normal distribution particularly useful in many areas of statistics, including hypothesis testing, regression analysis, and machine learning.


Comments
Post a Comment